At FutureCon Chicago Cybersecurity Conference, Glenn Stout from Reasonable Risk presented best practices on managing your cybersecurity and risk program and show it is effective. View the session.
SPEAKER: Glenn A. Stout, PHD
Partner, Reasonable Risk
CISSP, CISM, GSEC, PMP, ISO 27001 Lead Auditor, CMMC (RP)
Is your cybersecurity program effective? Does the C-Suite understand the progress you’ve made? Conveying the state of your security program shouldn’t leave Executives saying, “Why do we need to do these projects?” or “I don’t get it. Do we need to spend this much?”
In this session, Glenn Stout, Ph.D. will provide a way to communicate your security posture and remediation progress by answering straightforward questions such as “Are we ok?” and “How do we get to ok?” by using tools, graphs, and clear business language.
TRANSCRIPT
Thank you. Thank you. I don’t know who wrote that, but goodness. Thank you, everybody.
Pleasure to be here this morning.
We’re demonstrating our cybersecurity program is effective, and Welcome to our we have a quick thirty minutes here, and we’ll just go ahead and get right into it.
Our agenda for today, we’re gonna start with, our introduction and overview, and we’re gonna be do a little pointing over here when we need to. We’re gonna set up our cyber security program, operate our cyber security program, report on it, and then go over some conclusions.
Did a great job of introducing me. We appreciate that very much. Again, we have thirty minutes, but we’re gonna spend the first ten, fifteen minutes on this slide right here.
But I’m very happy for the kind introduction. Thank you very much. I’m very happy to be here.
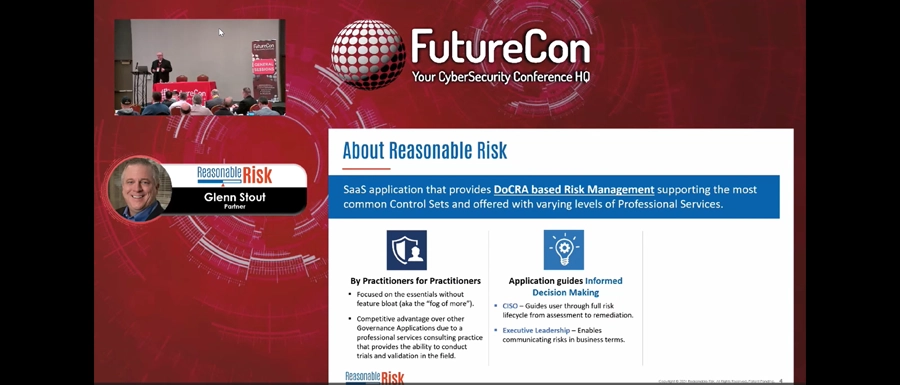
Let’s talk about Reasonable Risk as the organization I’m representing here today. It is a SaaS application that provides DoCRA-based risk management supporting the common control sets. Talking with a variant, area of also professional services. The application is by practitioners, for practitioners, and focused on the essentials of features without the fog of more.
There’s just enough to get the job done. It’s, competitive advantage over the other governance applications that we see out there. The application guides people to informed decision making your CISO decisions, your executive leadership decisions, communicating risks in business terms, It also drives behavior. How many times do you have this report out there, that risk assessment over there, this pen test over here, we put it all in one place, and it helps you drive behavior to get the job done.
Anyway, Going back to our overview, let’s talk about the problem. Here’s our problem statement for today.
We need to demonstrate that our cybersecurity program is effective.
We have our executives in the room.
We need to communicate our risk posture and our status of our risk remediation.
Is that a fun meeting?
How does that usually go?
It goes perfectly, right? It goes perfectly. The executives fully understand risk, your status, and your budget is approved.
Drop the mic and walk out. Right?
That ever happen?
Just me?
No.
Or is it many questions, frustrations, maybe budget is partially approved because you guys are good. They go, well, we’ll trust you. Whatever.
We’ll buy it. If you say so, Scooter, We’ll believe you.
Or option, see the excessive, they they listen politely and go, alright, no, but I don’t get it, but Whatever. When are we gonna be okay? When is this gonna be over? You know, when it what I don’t know.
So what we’re gonna try and do is talk about at least so they understand and say, I get it.
Okay? That’s what we’re trying to get to, the I get it answer.
No promises that they’ll prove your budget. At least they’ll understand what’s going on.
So we have to set up the cybersecurity program first.
The core questions that need to be answered. When you’re in that room, The questions that they’re going to be asking are these?
Are we okay and what’s our priority?
How is remediation going and are you asking anything of us. Remember, never go into a movie with, a meeting with executives without something to ask them.
What are these projects doing? What do they accomplish?
And how long is it going to be until we’re okay?
It’s probably not a surprise to know that good communication we have to start with a solid program foundation.
So we have to set things up correctly.
Therefore, we have to start with how are we measuring risks. Now, I know many of you probably measure risks in a lot of different ways. So discussing the various ways that risks are identified, measured, and planned for remediation, we would take hours. We can start right now and go all the way to five o’clock. And discuss nothing more about how to measure risk, but we’re not gonna do that today.
We’re gonna just say, DoCRA (Duty of Care Risk Analysis), At Reasonable Risk, we use the Duty of Care Risk Analysis approach or DoCRA, but the approach for this presentation can work with just about any risk analysis methodology.
So just assume DoCRA for this purposes and insert your own risk analysis methodology for purposes of this discussion. However, we do have to make some assumptions.
And the assumption is that our risk score range is between one and twenty five. We measure risk as impact times likelihood, and our acceptable risk is eight, meaning If the risk score is nine or above, we remediate if it’s eight or below, we accept it.
Sound good?
Okay.
Oh, wait a minute. We also have to include a safeguard risk score. Right? So when we’re doing DoCRA, We don’t just look at our inherent risk, which is the initial risk.
We also have to add our residual risk or safeguard risk, meaning we put the control in place for those familiar, we measure that risk too to make sure that it goes down to be below our acceptable level of risk. The safeguard risk is once the safeguard is implemented. And again, for those not familiar, it’s important to ensure that the cure is not worse than the disease. We certainly don’t want to put in excessive controls to make, you know, maybe the risk goes up in other ways that we maybe didn’t intend.
Once we’ve compiled all the risks from all those risk assessments, pen tests, scans, all those audits, we’ll end up with a risk register.
So, hopefully, you have a risk register in place.
But when we have our risk register, we have seventy five risks, let’s say, scattered all about. Let’s go ahead and put those in categories.
What category should we choose? Here’s a list I might recommend.
These are common security programs or domains.
These shouldn’t scare anybody in the room access control, HR security incident response. Take a picture.
There’s a good list of different domains, if you will. And put all of your risks in that particular category. I think they get access to this information.
And the idea is now I have my seventy five risks in these different categories.
So now what?
Based on putting our risks into these domains, we mean to tell a story. And that’s the thing I’ve tried to get across the folks. When people and executives come into these meetings, They don’t wanna just be bled at. They wanna be told a story. What’s the story of your program?
What’s the story? Let’s tell a story. Okay?
We start by saying, Hey, we started at this level of risk.
Here’s what we’re trying to get to.
Here’s what our current average risk is. And while our average is this, we do have some maximum risks in here because remember average is how I hide the outliers. Right? So we don’t wanna just be complacent on the average. We, hey, we’re average, but, you know, we got a couple that are still up here.
So we we show all these things.
Wouldn’t it be great if we had a graph of this?
Let’s go ahead and show a little graph.
This is a simplified graph. Let’s start here. We’re gonna build on this, by the way. We’re showing two of these elements right now. The first thing is, what’s the average and notice that we’re using two of our domains, right, access control and credential management.
Our blue rectangle is the average risk score initially before we’re immediate in anything. This is at fifteen.
The red dot is the highest risk in that particular domain before we did anything.
And those are never ever gonna change. That’s the beginning of your story.
Okay?
But we gotta show where we’re going.
So the green rectangle is where we’re going. So we gotta get down to the green line.
Green rectangle. And by the way, when we’re done, the average safeguard risk is gonna be the yellow dot. So we’re trying to go all the way down to below our yellow line of our acceptable level of risk.
There’s one more thing we have to show. So this is kind of a snapshot, if you will. But now to tell the story, we have to talk about what is happening today. So Imagine now, it’s a couple months later, we have to show the story. We added a couple other features here. The first thing is this Black Circle. The black circle is the maximum current risk score in this domain today.
Remember, the maximum risk score we started out with was this red circle.
Now it’s above it. What’s the story?
Risks went up.
Uh-oh. Got a problem here. That’s the story.
The red rectangle is the average risk in this area today.
What’s the story?
Risk went up. I have a higher maximum risk and a higher average risk. But what’s the story in credential management?
Average risk went down.
In just one little thing, we have a beginning middle and end to the story, and just one little vertical there.
Now, if we were gonna put it all together, This is for your takeaway. You have one sheet with everything in it. We have the initial risks, initial max, and everything that’s going on here. Now, I don’t wanna everybody, everyone just had breakfast or whatever. I know it’s nine o’clock in the morning.
I know that you don’t wanna show this to your leadership right out of the box. Imagine all those categories in one shot.
Now, when you’re showing this to your leadership, pick the ones that you wanna tell a story about. Say, hey, maybe even just pull out the two or three that you wanna tell a story about. Because when you look at this, you say, Hey, here’s a high Hey, we’re below our acceptable level of risk, but we still have an outlier there. Or in this case, we have still this wrist went up, where it was originally down here. So each one of these things has its own story.
Tell your story.
Okay? A lot going on in this graph, but it tells the story of your program at least from a domain perspective.
And that’s only the first thing that we’re gonna talk about today. Okay?
Let’s talk about the next thing.
Operating your cyber security program, now that we know the problem, so that helps us prioritize. Right? Got a big problem in access control. We got a big problem over here. We got this and that or whatever.
So now that we know the problem, we have our risk register. It’s organized by domain. Now we need to remediate stuff. So now we need to create some projects.
Now, how do you guys create projects?
And all the wonderful, stuff that was talked about, mean one of those letters in front of my name was project management professional. Anybody in here have a PMP?
It’s a rare swizzle to have risk and project management together. I know that everybody in this room loves project management, right? That’s why you got into cyber security. Like, those project management guys, meh, they’re making us do stuff and be accountable.
Well, the idea behind what we’re trying to do here is try and give us just enough project management to get the job done. Okay? Not trying to turn anybody in here to PMPs or whatever, but we’re trying to just do just enough to get remediation of stuff done. Okay?
So we wanna turn risk maybe into a ticket. Maybe we have one or two little risks that just somebody has to click a box somewhere. So we turn that into a ticket. Or maybe there’s a big risk, like we don’t have a change management program.
That’s one risk that could take a year to pull together, but that’s only one risk. Or maybe we collect similar risks in the projects such as, you know, access control, awareness and training, or whatever the case may be. Or maybe we put all our risks for like that are high risk, like all of our sixteens and twenties into Q1 because we wanna do those first.
Either one of those work, and they’re all good. So we wanna go ahead and collect all those risks and projects because This helps the stakeholders understand our approach and fifteen projects is way better than chasing around seventy five risks.
And this, again, enhances the ability to communicate to stakeholders.
So what else do we need for projects?
Because again, this is all about the setup. Right? So basic project management dictates that at a high level, we need to develop information that can help us complete the project but communicate status. In order to communicate status, we have to set stuff up for the first time.
I know it’s a pain, but we have to get at least some basic information pulled together. How much does a project cost?
If you guys don’t remember anything today, remember this, how much risk reduction does this project produce?
I’ll say it again. I’ll drop my glasses. I’ll drop my feet. How much risk reduction does this project produce?
That’s the connective tissue that we’re bringing together with project management and risk analysis today. Okay?
That’s the magic elixir. That’s the secret sauce.
How much risk? How much risk reduction does this project produce? That’s the that’s it.
What are the dates that this project has to be completed? What about the whole project?
This is another example of getting the right data from meaningful reports what does that look like? So now we have a nice little graph here that has the list of the projects, the dates, the count of the risk that it’s going to remediate if I complete this project, the costs for this project, both in hard and soft costs, And what’s that far column say? That’s the risk reduction that I can enjoy when these projects are completed.
Remember how I said the risks are scale of one to twenty five, and I have like fifteen risks, and they could be at a sixteen, at a sixteen, at a twelve, and a twelve, and a sixteen. And I’m trying to get all those to go down to eight and six and four and six and eight. If I go from sixteen sixteen sixteen to four eight six six That’s my risk score reduction. Three sixty eight to one sixty eight. Now I got a story to tell. I have a story to tell.
Here’s what you’re buying. Risk reduction.
Okay.
Now, I originally was writing this presentation, and I just kinda wrote a little title, said, that was all the prep work. And I just kinda left it. Because that’s really what it is. That’s all the prep work.
So we have prepared our information for demonstrating program effectiveness So we have defined our acceptable risk level. We have our risk register. We have our risk score. We have our risk average.
We are appropriately categorized by domain. We have our remediation projects. We have the cost of the project. We have the timing of the projects.
We have the resources aligned of the projects, and now we can finally get to work.
When we get to work, now imagine we’re working for a month or whatever. Now we need to do periodic status reports. This is where the magic happens, right?
We use standard project management approach, coupled with important risk metrics to provide a meaningful snapshot of progress.
This will get us that, oh, I get it, deal.
We wanna keep it simple.
Again, we’re not trying to turn into PMI certified people here.
We wanna look at the so called general old triple constraint scope schedule and resources.
How does it look? We all know those at least. If we have a negative status, do we have a reason that we can summarize? If things are late, how late are they?
Do we have an action plan? Do we need the boss to sign off on? Hey, we need more money, more time. We need these three people to join this project for the next two weeks.
Let’s look at a chart that shows all that stuff.
We have a list of all of our projects here. We have the project owner. We have the date. We have the estimated date. We have how many days it’s late.
We have our schedule, scope, and resources, yellow, red, green. Everybody understands that.
And the count of the unacceptable risks that are aligned to that project.
If we don’t do this project, these risks will not be remediated.
That connective tissue from the wrist to the project is the secret sauce.
If we don’t have a good status, we have our action plan here.
Okay?
That’s the thing. We wanna provide that status.
Now, what if they’re questions? Hey, I don’t know about that project. What was that project supposed to do again?
Have a summary ready in your back pocket. Bam.
Here you go. Here’s project detail around that project. Here’s what it’s supposed to do, boss. Here’s the different. Here’s the risk remediation.
Here’s what the risk is before. Here’s what the risk is gonna be after. Any other questions?
Give me money.
Hey, what about that one risk?
Oh, give a list of risks. Have the risks ready to go. Here’s my list of risks.
Here’s the detail about that risk.
Bam.
Any other questions?
Here you go.
When will we be okay?
When is this when are we gonna be okay?
Now, we all know the word.
That’s a tall order. Anybody ever get asked for like a two year road map or something like that?
Just me, anybody?
All the time, right?
What about this?
When you identify your risks, you define your acceptable level of risk. You create projects and associate risk to it. You determine the dates that risks are going to be remediated.
You should be able to demonstrate how risk scores are reduced over time.
You should be able to forecast when you’re in at least your entire program is gonna be at an acceptable level of risk. At a particular point in time. Don’t then that makes sense, right? From a math, just simple math. Right?
And we might be able to come up with a chart that looks something like this.
So what the heck is this?
Let’s go over this.
If I started with the these columns are my average risk.
And my average risk goal is to be below this kind of aqua line going across here.
If I baseline my plan and say, Hey, I have all my risks, I have all my tasks, I have all my projects, and I have all my scores. And if I close all these dots, the big dots are a project being closed.
My baseline plan is this brown line or orange line, whatever color that is, The minute I started my plan, it looks like I’m gonna be good to go in April of twenty twenty four.
The purple line is reality.
So whenever I close projects and I do this and I do that, that’s what’s happening in reality. So over time, you could see this example, we were behind, then we caught up, and now we’re a month ahead. And according to this, I’m gonna be at an overall programmatically at an acceptable level of risk in February of this year.
Now does that mean we stop working? No. But it means that we’re below a threshold of overall acceptable level of risk from programmatically.
That’s something else, isn’t it?
Now how can you do that?
Little excel, little PowerPoint.
It answers your four core questions.
Are we okay? And what’s my priority?
How is remediation going? And is there anything else you need from us? What do these projects accomplish? And how long are we okay? Well, First question is, we have our risk scores in our security domain.
The second one is we have our project status, all the colorful, blue, yellow, green. We have our project and risk detail. If we have to drill down, what do these projects accomplish? How long we’re gonna be okay? We saw our road map there just a moment ago.
What does our final presentation look like?
Hey, we got this. We tell a story. Hey, we got this as below. We got this as above. We got this problem. We got that problem. Here’s the story with these particular things.
The way we’re fixing it, we have this project, this project, this project, this is red, yellow, green. Here’s our action plan. Here’s we need help. We need this. We get that.
Oh, you need to drill down on this project. Here’s that information. We need to drill down on this particular risk description, and we can drill down on that.
Oh, and here’s the road map. We are expected to be at our acceptable level of risk in February of this year. And then you drop the mic and you leave.
Conclusion, the problem was your typical cybersecurity updates have executive say, and I don’t understand what we need to do and I don’t get it. The solution is we try to put things in a position where we say, here’s what you’re getting your money for. Here’s the risk reduction that you’re getting and they say, alright, now I get it. I at least, you know, and these are the four main things that we’re producing and providing to allow that to happen.
And we have a few two or three minutes for questions.
I’m opening up for questions at this time. We have a microphone here if anybody has any questions.
I can go, yes, question right here.
Glenn (repeating question): Where are the risk scores coming from?
Attendee: Everything have the risk score.
Right.
Yep.
How is that determined? That was the so the question is, how are the risks I have to repeat for the online people? So the question is where are the risk scores coming from?
That’s that first part, DoCRA. So the thing is your risk scores and how you’re measuring and identifying and scoring risks, that’s the thing that we can spend all day on. It’s whatever risk program you’re following. We choose to use, Duty of Care Risk Analysis or DoCRA. You can see me at the Reasonable Risk and HALOCK booth, and we’ll be glad to tell you all about it.
That’s a whole program that you could spend all day on.
That I answer your question, sir? Yep. At least give you a teaser. Anything else?
If anybody wanna see how the magic happens, we’ll be at the Reasonable Risk booth right as you enter the door.
Thank you very much for your kind attention, everybody.
Learn more about the Reasonable Risk GRC SaaS Tool
Learn how Duty of Care Risk Analysis (DoCRA) can help you achieve reasonable security:
What is Duty of Care Risk Analysis (DoCRA) for Cybersecurity?
What is Duty of Care Risk Analysis (DoCRA) for General Counsel?
What is Duty of Care Risk Analysis (DoCRA) for Regulators?
What is Duty of Care Risk Analysis (DoCRA) for Auditors?
What is Duty of Care Risk Analysis (DoCRA) for Executives?
What is Duty of Care Risk Analysis (DoCRA) for Risk Managers?