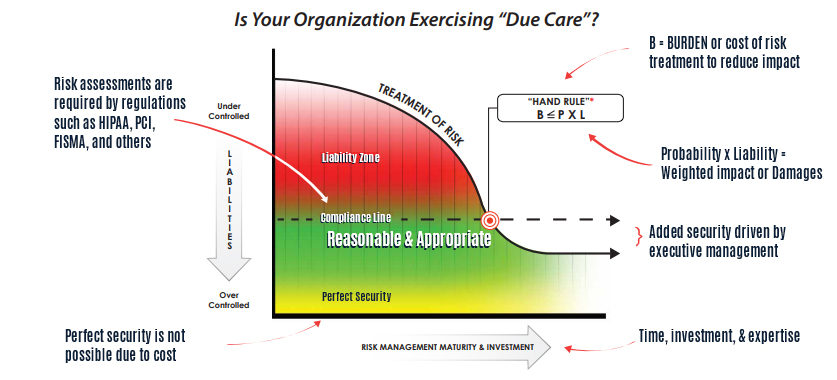
While presenting a talk at CAMP IT last week I got into a number of conversations with attendees about the Hand Rule and security costs. At HALOCK Security Labs we talk about the Hand Rule a lot. Also known as the Calculus of Negligence, it is a way that an organization can mathematically estimate what a “reasonable” investment would be to prevent the risk of a threat. Briefly, the Hand Rule states that if the burden for reducing a risk is less than the likelihood of the risk times its impact, then the burden is reasonable.
Think of it this way. If a woman owns a store with a sidewalk out front and there is a winter storm under way, she might consider it a good idea to shovel her sidewalk and to throw some salt down on the ground to keep the sidewalk safe for passers-by as well as her customers. Hiring a person to clear the sidewalk costs her $40.00 through the duration of the storm.
Our shop owner thinks that if she doesn’t hire the person then at some point during the day someone could fall and hurt themselves and incur a thousand dollars or more of medical bills. In that case her calculus of negligence would look something like this: “A cost of forty dollars for the day is less than the $1,000 per day that an injury may occur, so it is reasonable to pay the forty dollars.” To paraphrase Judge Hand, “the burden is less than the probability times the cost of the injury (or “B < PL”).
The Hand Rule has come under a lot of scrutiny and is not often used in negligence cases, but to information security and compliance professionals it is a very worthy bit of math to consider. The regulations that require us to secure personal information require us to perform risk assessments, and the risk assessment methodology that the U.S. government provides us (NIST Special Publication 800-30) presents us with a strikingly similar calculus for risk; Risk = Impact * Likelihood.
Consider a risk register as a table of columns and rows. The columns itemize the factors of risk that NIST SP 800-30 requires us to address; an information asset, its controls, its vulnerabilities, foreseeable threats, then the likelihood, impact and calculated risk that result from the threat. The blue columns on the left represent our risk calculation Risk = Likelihood x Impact.
Then to the right of that there are a few more columns in green. These columns itemize the controls we could put in place to reduce the risks to a reasonable level. These represent the Hand Rule, reminding us that if a burden to reduce the risk costs less than the impact that it is trying to address, then we have a reasonable risk treatment control.
There are limitations to this calculus, of course. For one, reasonableness is not based solely on considerations of cost, but also on how well the burden (the risk treatment investment) reduces risks to a reasonable and appropriate level. In this way, the cost of a burden represents the higher limit of a reasonable risk treatment, while the effectiveness of the control would represent its lower limit. (I will address how that lower limit is calculated in a later blog.)
But consider the added power you have when you conduct a risk assessment with the Hand Rule in mind. When an unusual or a seemingly unreasonable control is being requested of you, and your risk assessment is used to determine whether the control is reasonable, you can efficiently weed out those recommendations that are too costly.
So while the litigation world has struggled with limitations to the Hand Rule, the compliance world can find profound value in it. The HIPAA Security Rule, Gramm Leach Bliley, the Federal Trade Commission (FTC) and Massachusetts 201 CMR 17.00 (among others) are telling us that we must conduct risk assessments to determine our reasonable and appropriate levels of security control. When the federal government provides us with a risk equation of Risk = Likelihood x Impact to calculate that risk, and tells us that our investment must bring those risk levels to a “reasonable level” then we have the makings of a strong justification for not spending too much to address any one risk.
Now that we’ve seen how a risk assessment can help us establish the upper limits of a “reasonable control,” I will in my next blog describe how the lower limits of a “reasonable control” can be calculated.
Learn how Duty of Care Risk Analysis (DoCRA) can help you achieve reasonable security:
What is Duty of Care Risk Analysis (DoCRA) for Risk Managers?
What is Duty of Care Risk Analysis (DoCRA) for Cybersecurity?
What is Duty of Care Risk Analysis (DoCRA) for General Counsel?
What is Duty of Care Risk Analysis (DoCRA) for Regulators?
What is Duty of Care Risk Analysis (DoCRA) for Auditors?
What is Duty of Care Risk Analysis (DoCRA) for Executives?