When Verizon Business decided to publish their DBIR they had been amassing cyber incident data for years through their incident response and forensics investigations team. They decided to publish the trends they were seeing in a format that was both informative and engaging so we could learn how to protect ourselves.
Then in 2010, the Verizon DBIR team introduced the Vocabulary for Event Recording and Incident Sharing, or VERIS, to allow any organization to contribute their breach data to the report. The more data we have, the more trending information we can share. VERIS is a data structure that helps any organization to contribute information they gathered about one or many incidents. It helps determine the kinds of assets that were exploited, the threats that were used, the locations of the attackers and victims, and characteristics about the impacts of attacks. But VERIS also allowed the community to see the data in a single dataset to use for their own purposes.
The VERIS Community Database (VCDB) today contains more than 10,000 records of attacks with more than 2,500 columns of characteristics about each attack.
So now the cybersecurity community has a DBIR that is engaging to read but hard to use for data analysis, and a VCDB that is numbing to read, but, well still hard to use for data analysis.
It's not that the VCDB's data is unreadable or cryptic. It's that a data analyst must both understand how cyberattacks work to understand how to relate the VCDB's data elements and must have the patience and facility to manipulate data until patterns emerge.
Now where in cybersecurity are you going to find obsessives who do both of those things … alright. Probably everywhere. But this is the kind of research and development that is often shuffled low on the to-do list when there are on-the-wire or on-the-chip patterns to find instead.
But at HALOCK Security Labs this is the kind of weird puzzle we want to solve. If you've wondered whether the HALOCK Security Labs team shows up to work through a clean room with white coats and protective eyewear, then you're only wrong about the room and the coats. The labs aren't per se, a chem lab with beakers and Bunsen burners. Our labs are our consultancy teams who solve problems for our clients that nobody else has solved.
We figured out what reasonableness meant and instituted that at cybersecurity organizations and in the law. Why? Because our clients were struggling with a problem that everyone was struggling with – how to demonstrate when our cybersecurity investments were enough.
We also figured out how to use the VCDB to estimate the likelihood of cybersecurity events in organizations, depending on their industry. We call it the HIT Index (HALOCK Industry Threat Index) , and we gave it away in CIS RAM 2.1, the risk assessment method provided free to the cybersecurity community by Center for Internet Security.
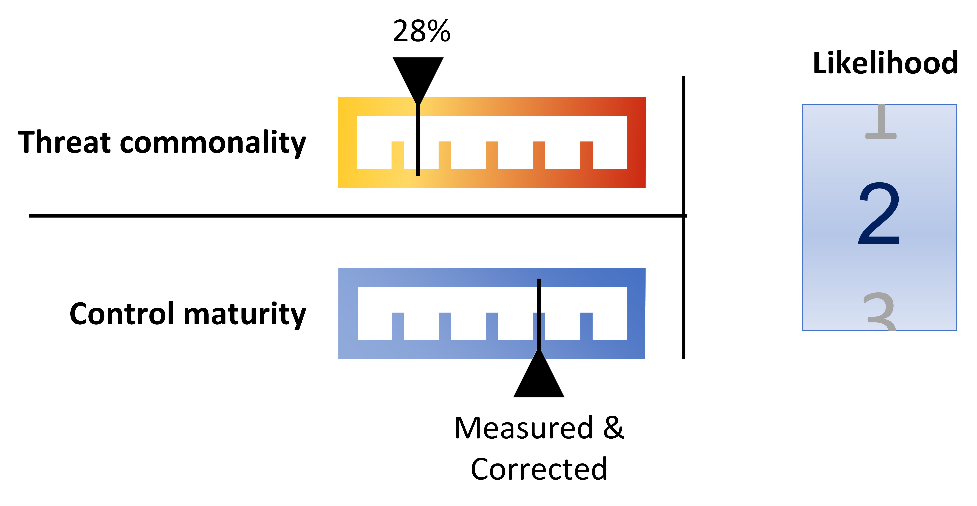
The HIT Index (what is known in CIS RAM as the VCDB Index) is a simple correlation between the VCDB data and a set of cybersecurity controls. We simply state the more commonly an asset appeared in incident records, the more likely it would be the cause of an eventual incident, unless its corresponding safeguards were strong. We used this simple insight to drive the likelihood scores in our risk assessment method. And in CIS RAM, this is known as "Expectancy."
If you use CIS RAM, you'll notice that controls maturity is compared to the commonality of assets as they occur in the VCDB. You'll also notice that there is one dataset driving the Expectancy score (there is no way to model asset commonality by industry in CIS RAM). These diagrams show roughly how the VCDB works.
Figure 1 – Low threat commonality and high control maturity
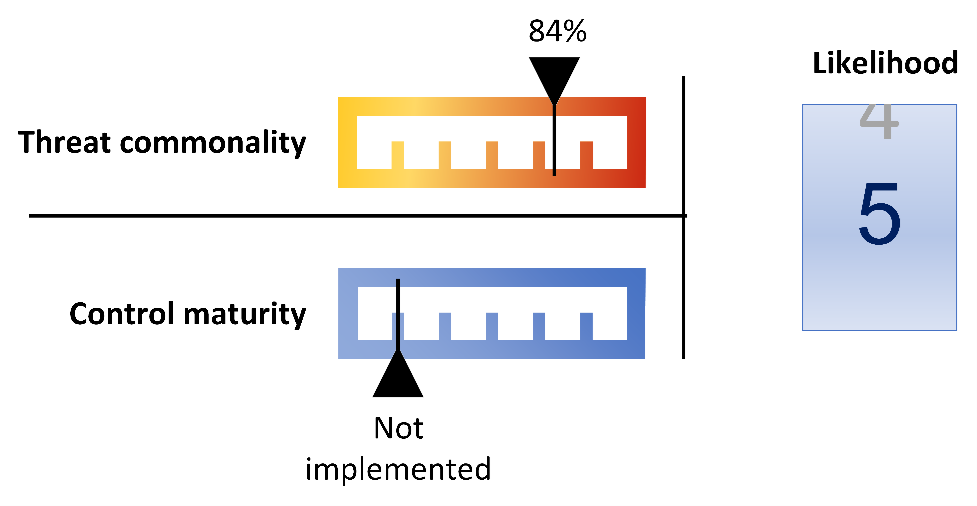
Conversely, Figure 2 shows how a high Expectancy score would result from a high asset commonality and a low control maturity.
Figure 2 – High asset commonality and low control maturity
HALOCK uses a more complex likelihood model that considers the industry each organization is in. One of the most impressive things we noted in the VCDB was that threats in each industry seemed to map to how data is managed in each industry.
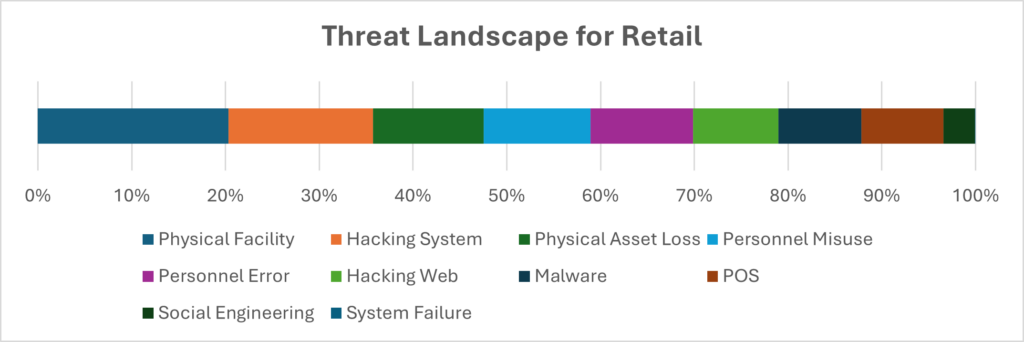
For example, the threat landscape for retail companies look like banks because so many data interactions occur at customer-facing terminals at local facilities. So attacks at banks and retailers both commonly prominently feature attacks at facilities where card readers are present.
HALOCK Industry Threat (HIT) Index
Figure 3 – Threat Landscape for Banks
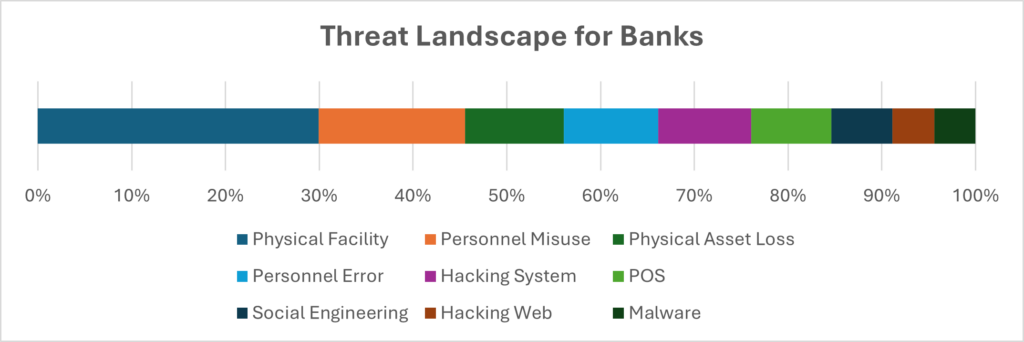
Figure 4 – Threat Landscape for Retail
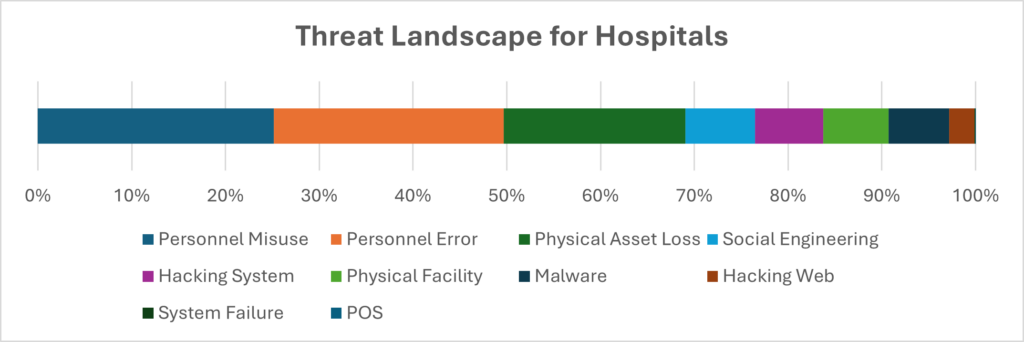
And insurance companies' threat landscapes don't look like banks, despite both being financial services organizations. Insurance companies look like hospitals because both have many individuals handling information about individuals, and many employees sending batches of data to consumers and third parties. This makes human-based errors much more common as threats in those industries.
Figure 5 – Threat Landscape for Insurance
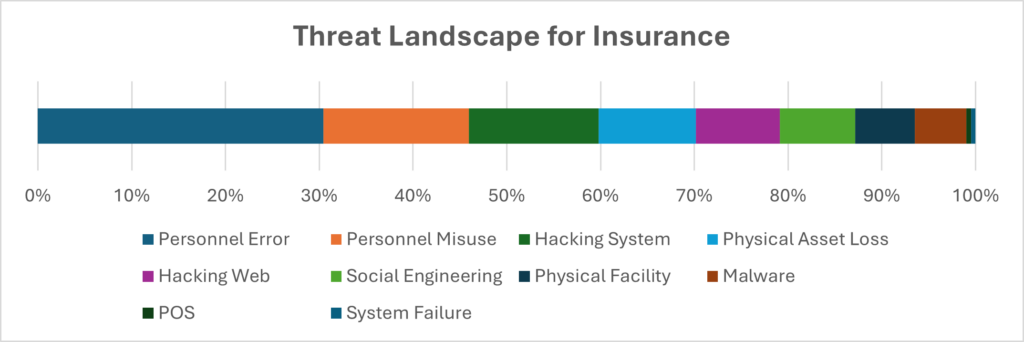
Figure 6 – Theat Landscape for Hospitals
When using VCDB's data, organizations don't need to guess about the likelihood of threats in their environment. They can simply state how capable or mature their security controls are, then the HIT Index quickly correlates that maturity score to the commonality of the threats the controls prevent. And, boom, you have your likelihood.
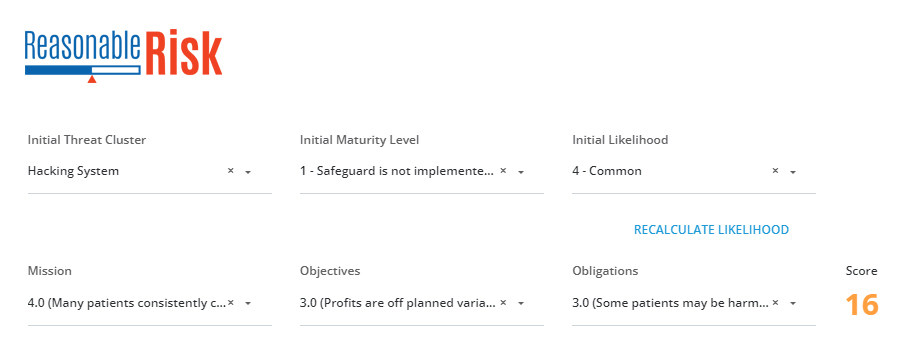
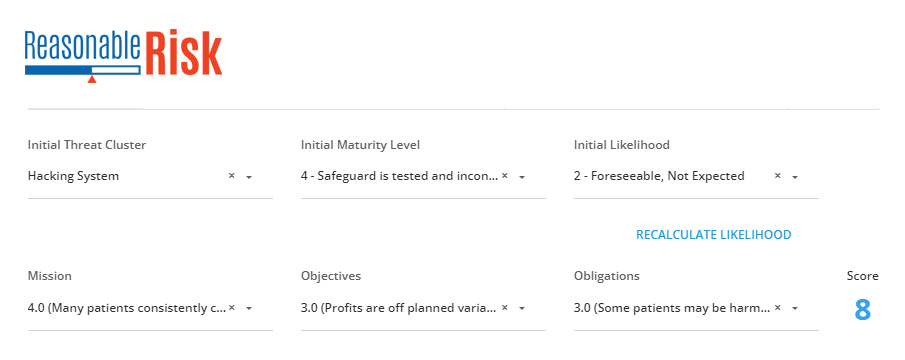
Estimating likelihood based on real threat data makes risk analysis credible and automatic. The Reasonable Risk SaaS application uses the HIT Index to automatically calculate risk likelihood, and risk itself. See below how the threat cluster "Hacking System" is compared to the Safeguard Maturity to derive a high Initial Likelihood score. That score then informs the risk score (16) when it is multiplied by the highest maturity score.
Figure 7 – How HIT Index is Automated in Reasonable Risk SaaS
Once an organization improves its control maturity, as in Figure 8, the likelihood decreases, as does the risk score. This organization achieves reasonable risk by increasing its control maturity to '4' even though a maturity of '5' may be achievable.
Figure 8 – How HIT Index is Automated in Reasonable Risk SaaS
The guesswork is gone. You're running your risk analysis using the best threat data available to the cybersecurity community.
When Verizon asked HALOCK to contribute to 2024's DBIR, it was because we found a way to practically apply Verizon's data for risk assessments. You can use this data in your risk analysis using CIS RAM 2.1, if you are okay with likelihood data for the general public.
If you need to run your risk analysis based on threats in your industry, you'll need a more careful breakdown of the VCDB data.
We recommend you read Appendix D of the 2024 Verizon Data Breach Investigations Report for inspiration if you want to build your own version of the HIT Index. If you want to get to the analysis right away, contact us.
It takes a calculated risk to be secure. Review your threat landscape and develop reasonable controls for your risks.
By Chris Cronin, Partner